
Monthly Securities Finance Market Review: September 2026



Equilend’s Head of Trading Solutions, Mike Norwood, shares his September securities finance market review highlighting record trading volumes across NGT, driven by higher rates, increased fixed income activity, and continued growth across all global regions. The following data has been measured and derived from Equilend NGT.
A Record Quarter, and a Record Month of Activity
September closed the strongest quarter in NGT history. The platform processed 12,479,750 trades across Q3 2026, up 5.3% on Q2 and 21.1% on the same quarter last year, with every region growing: Canada up 23.9%, APAC up 22.9%, US up 22.1%, EMEA up 15.3%, and S.Am. up 0.4%. September carried 4,210,376 trades, up 7.3% month-over-month and 19.4% year-over-year, making it the third-highest month on record behind July and March (all three records being reached in 2026).
The backdrop was not a quiet one. The Federal Reserve raised rates on September 16th, its first increase since 2023, and long yields repriced sharply through the month. Higher financing costs together with a market where returns were spread unevenly is the kind of environment that moves securities lending toward the center of portfolio activity, and participation reflected it. On an average day in September, 139 distinct borrowers and 86 distinct lenders were active in US equity, alongside 73 borrowers and 72 lenders in EMEA and broad participation in APAC. That is a broad set of counterparties on both sides of the book.
Equities: Dispersion and Where the Activity Sat
Equity activity in September was shaped by dispersion rather than direction. The S&P 500 finished the month down 0.35%, but the spread underneath was wide: the equal-weight index fell 4.81% and the Russell 2000 lost 5.25%, while the Nasdaq gained 1.93%. Information Technology and Communication Services were the only sectors to rise, and Financials, Materials, Real Estate, and Utilities led the declines as higher yields bit hardest into the rate-sensitive and cyclical parts of the market. Narrow leadership alongside broad weakness is the sort of tape that generates two-sided securities finance activity, because financing and hedging interest settles on different names than the index return implies. NGT equity trades rose 6.3% month-over-month and 25.0% year-over-year, with all five regions higher.
The country detail shows where that activity concentrated. Hong Kong led the larger markets at up 27.5% on count, followed by Australia (up 21.3%), the UK (up 18.1%), Taiwan (up 18.2%), and Korea (up 17.9%). Taiwan and Korea carry the AI hardware complex where exports ran strong, and Hong Kong is consistent with the AI and consumer names that led APAC lending again this quarter. Japan was the exception, down 3.9% on count while remaining the largest non-US market, a cooling after several quarters of onshore records.
Fixed Income: Rates, Collateral and the Rebuilt Curve
Fixed income was the month’s defining event, and the driver was policy. The FOMC raised its target range by 25 basis points on September 16th to 3.75% to 4.00%, the 10-year Treasury yield climbed from 4.75% to 5.29%, its highest close since 2002, and the Bloomberg US Aggregate returned -2.61% in its weakest month in years. High-yield spreads widened from 263 to 312 basis points into month end, their widest since early April. Higher yields and a steeper back end reset the economics of financed positions and raise the value of collateral mobility, and drove platform activity followed. NGT fixed income trades rose 10.1% month-over-month and 6.1% year-over-year, with counts higher in all five regions, led by EMEA at up 26.3%. Fixed income contributed 26.2% of total platform activity for the month.
The mix is the more useful signal. Corporate bond trades rose 15.8% and US sovereign debt counts rose 22.8%, so growth was spread across both credit and rates rather than sitting in one pocket. The rate-band distribution stayed anchored to general collateral, with 85% of US fixed income trades and 95% of Canadian trades clearing in the 0 to 20 basis point band, the profile of financing and balance-sheet flow rather than directional positioning. The one nuance worth flagging is US sovereign debt, where count rose sharply even as average ticket size fell.
Specials: Activity Outside the GC Band
Across the quarter, trades clearing outside the general collateral band, defined here as fees above 50 basis points, rose 33.7% year-over-year on count, and their share of total NGT trades reached 25.2%, up from 22.8% a year earlier. On the month, non-GC counts added 9.0%. That measures mix rather than scarcity: a larger share of the book was priced away from general collateral, the band where broad balance-sheet financing concentrates. The rate-band distribution shows how far outside GC some of that activity ran, with 12% of US, 12% of Canadian, and 14% of APAC equity trades clearing above 500 basis points, a persistent deep-end slice rather than a one-off. Broker-to-broker trades added 4.3% month-over-month and 19.6% over the quarter.
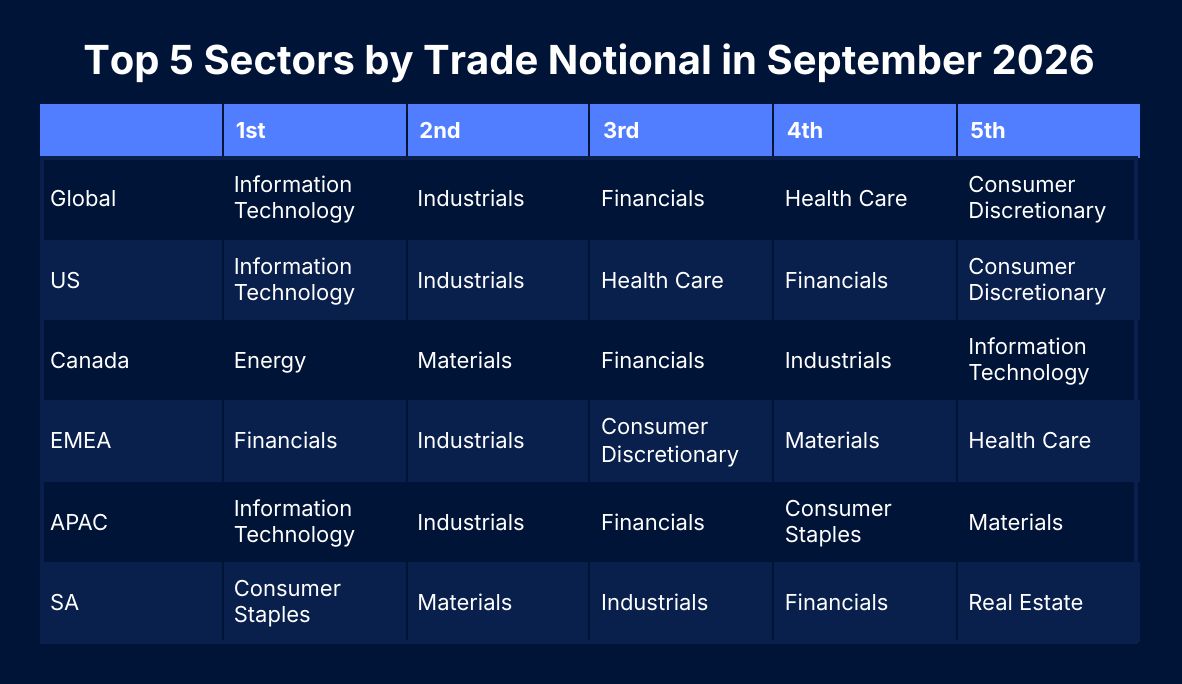
The busiest individual lines on the platform in September were Kimberly-Clark, Charter Communications, Dick’s Sporting Goods, SoFi, and Super Micro (1,922). They span consumer staples, media, specialty retail, digital finance, and AI hardware, so no single theme explains the list; what they share is that they were the most actively traded names on the platform. By sector, Industrials led on count at 441,124 trades, with all five of the top global sectors up month-over-month on count.
The Quarter in Context, and the Road to October
Step back, and the quarter shows activity broadening rather than concentrating. Product mix kept widening, with ETF/ETN trades up 56.8% year-over-year, the fastest-growing equity-related type on the platform, alongside convertible debt up 26.0%, and corporate debt up 9.5%. Index and ETF activity matters to a lending book because the hedging, creation, and redemption flow around it runs through securities finance. The industry data points the same way: Equilend Data & Insights reported $5.64 billion of global securities lending revenue in Q3 2026, up 22% year-over-year, with APAC again leading equity lending on demand for Hong Kong-listed AI and consumer names.
The policy and regulatory calendar stay heavy into year-end. The Fed meets again in October with further tightening still in play, the ECB and Bank of Japan have both tightened, and the structural work around T+1, US Treasury clearing and tokenized collateral keeps advancing. Each of these affects how collateral moves and how quickly positions can be financed or covered, which keeps securities lending close to the center of the client conversation.
Stay tuned for the latest securities finance trends, trading analysis and commentary with Equilend’s Monthly Trading Commentary.


