Insight
July 2025
The Purple
A Market's Maturation:
The Continued Growth of ETF Securities Finance
The long-term growth of the Exchange-Traded Fund (ETF) market is one of the most significant structural developments in modern finance. As ETFs have become foundational components of institutional portfolios, the ecosystem supporting them has matured in tandem. A key part of this story is the continued growth of the ETF securities finance market, where the use of these instruments for hedging, expressing macroeconomic views and generating alpha has reached substantial scale.
The global securities finance industry saw robust growth in the first half of the year, with revenues for lenders reaching $5.2 billion, a 9% increase over the same period in 2024. EquiLend Data & Analytics analysis shows the ETF lending trend accelerated further in H1 2025. On-loan balances for ETFs grew 18% from January to June, with monthly lending balances exceeding $85 billion in peak months.
Drivers of a Continuing Trend
1. Broadening Participation and Deepening Usage:
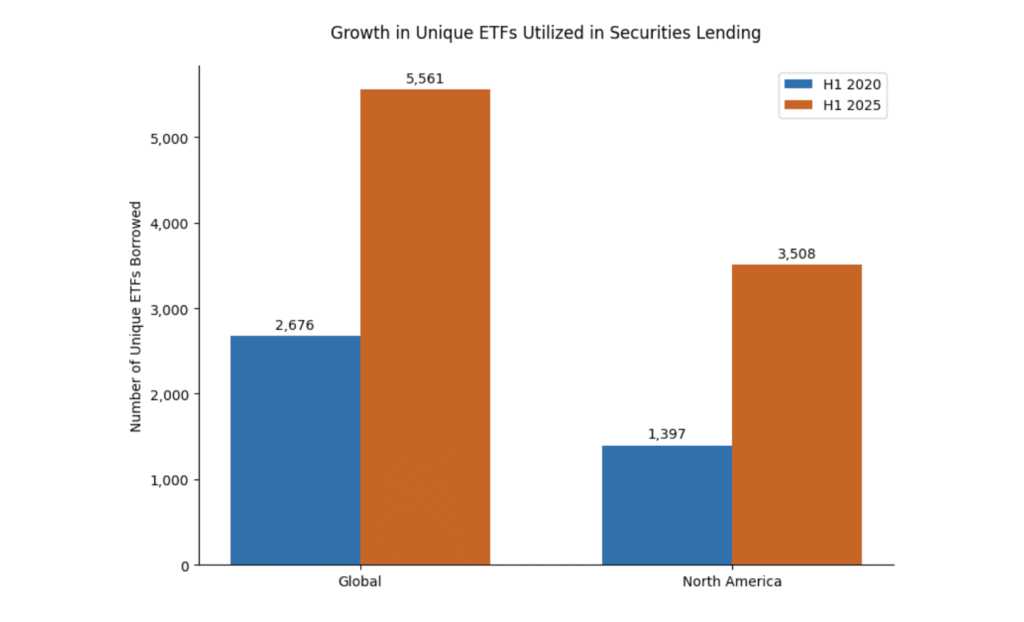
The most direct evidence of the market’s expansion is the significant growth in the number of unique ETFs utilized in securities finance. The number of actively borrowed ETFs globally has grown to almost 5,600: more than 200% increase in the past 5 years (Fig. 1, previous page). This growth was consistent through the first half of the year, with the number of securities on loan growing by nearly 10% globally since January 1. North America saw a similar trajectory, with a 250% year-over-year increase to more than 3,500 unique ETFs, and a 9.5% increase in H1 alone. This indicates that a wider range of funds are being used for financing and shorting strategies.

2. Institutional Adoption as a Core Strategy:
The primary driver remains the deepening adoption of ETFs by institutional investors. In the securities lending market, this translates into consistent demand for borrowing ETFs as an efficient, single-transaction method for hedging portfolios or expressing a directional view on a broad sector or theme.
3. The New Era of Fixed Income:
A significant portion of the growth in H1 2025 was concentrated in fixed-income products, with HYG (iShares High Yield Corporate Bond ETF) leading with a reported $25.5 million in lending revenue, followed by LQD (iShares Investment Grade Corporate Bond ETF) at $13.5 million. The high demand for these products suggests sophisticated investors are actively using these ETFs to position for credit spreads widening in the event of an economic slowdown or to hedge against long bond positions.
4. Expanding Supply and Market Liquidity:
Demand growth has been met with a corresponding increase in supply. Our analysis of “Total Inventory Quantity” shows ETF inventory growing by 12% in the first half of the year, compared to a reported 1% for all other asset classes. This expansion enhances overall liquidity and creates a virtuous cycle that attracts more participants.
A Holistic Framework for Interpreting Market Signals
To truly understand market intent, a holistic view of securities lending data is essential. A combination where high utilization is met with a rising borrow fee can signal strong directional conviction. At a high level, the value-weighted average borrowing fees for broad asset classes are often comparable, with ETFs ending June with a borrow cost of 53 bps and Equities ex-ETFs at 58 bps.
Drilling deeper into specific ETF categories reveals significant divergence. The highest average fees are found in the Leveraged and Inverse ETFs segment. These ETFs utilize derivatives, allowing investors to get unique exposure through owning a single liquid asset. Leveraged ETFs aim to amplify, or deliver a multiple (2x, 3x) of the return of the specific index or security it tracks, while Inverse ETFs give investors short exposure to the underlying security. These tactical instruments, with over $12.4 billion on loan, had a value-weighted average fee of 212.7 bps, nearly four times the broader market average and indicative of the premium paid for their specialized exposures.
The market structure also shows significant concentration. The top 10 most-borrowed ETFs account for 36.4% of total asset class lending volume, a much larger share compared to the top 10 single stocks (7.1%).
You may also like:
The Purple
In this 20th edition of The Purple we explore rising revenue and...
Read MoreThe Purple Edition 19 | A Market’s Maturation: The Continued Growth of ETF Securities Finance
Insight July 2025 The Purple A Market’s Maturation: The Continued Growth of...
Read MoreThe Purple Edition 19 | Tariff Turbulence: How Trade Wars Reshaped Securities Lending in H1 2025
Insight July 2025 The Purple Tariff Turbulence: How Trade Wars Reshaped Securities...
Read More


