Insight
July 31, 2025
Market Flash
Market Flash: Most Shorted Stocks
Key Takeaways
- Extreme Outperformance: The 50 most-borrowed stocks have returned 27.1% year-to-date (YTD), dramatically outpacing the broader market.
- Short Seller Pressure: This dynamic indicates a “pain trade” is underway, likely forcing short sellers to cover positions and potentially driving prices even higher.
- Risk-On Sentiment: The trend points to a strong risk-on market environment where heavily shorted names are being rewarded.
Market Commentary: The Pain Trade in Crowded Shorts
A key theme emerging in the market year-to-date is the notable underperformance of consensus bearish trades. Following a period of cautious sentiment carrying over from late 2024, many market participants positioned for continued economic headwinds. However, resilient economic data and a stabilizing interest rate environment has challenged that view, creating a difficult environment for short sellers. Data from Bespoke Investment Group shows the most heavily shorted stocks strongly outperformed in July. More so, Goldman Sachs notes this type of squeeze is a recurring feature of market cycles, confirming the current rally fits a historical pattern. Our securities lending data provides a unique lens through which to quantify this dynamic, showing precisely where this “pain trade” has been most acute.
Heavily Shorted Stocks Significantly Outperforming YTD
Our analysis of the Russell 3000 (R3K) Securities Lending data for 2025 year-to-date reveals a strong correlation between high utilization rates (demand in securities lending and highly correlated to shorting activity) and year-to-date (YTD) stock returns.
Methodology
We analyzed securities lending data for the Russell 3000 (R3K) index from year-end 2024 to the present, using each stock’s average utilization rate as our primary proxy for short interest. After filtering for securities with consistent borrowing activity, we segmented them into deciles based on their utilization. To examine performance at the extremes, we also isolated the 50 most and least borrowed stocks, alongside the top and bottom 1% of the universe by utilization. Finally, we calculated the mean year-to-date (YTD) return for each group to assess performance. All performance figures in this analysis refer to total stock returns in the cash equity market.
Top Bucket Utilization Bands By:
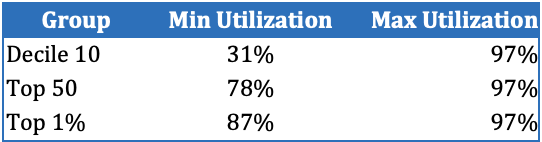
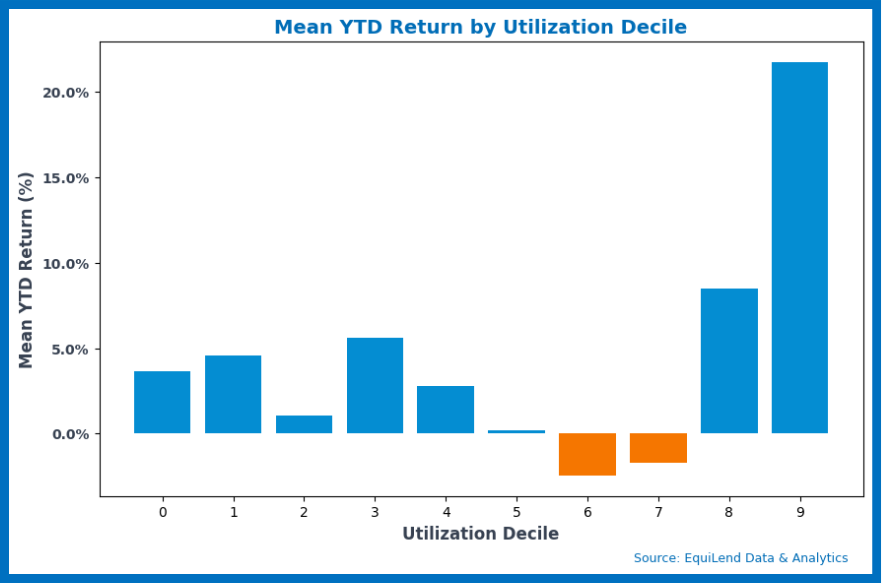
Decile Analysis
- Stocks in the highest utilization decile (Decile 10) have shown a remarkable mean YTD return of 21.8%. This significantly exceeds the returns of lower utilization deciles and the broad market.
- Conversely, lower utilization deciles exhibit lower mean YTD returns. For example, Decile 1 (lowest utilization) has a mean YTD return of 3.7%.
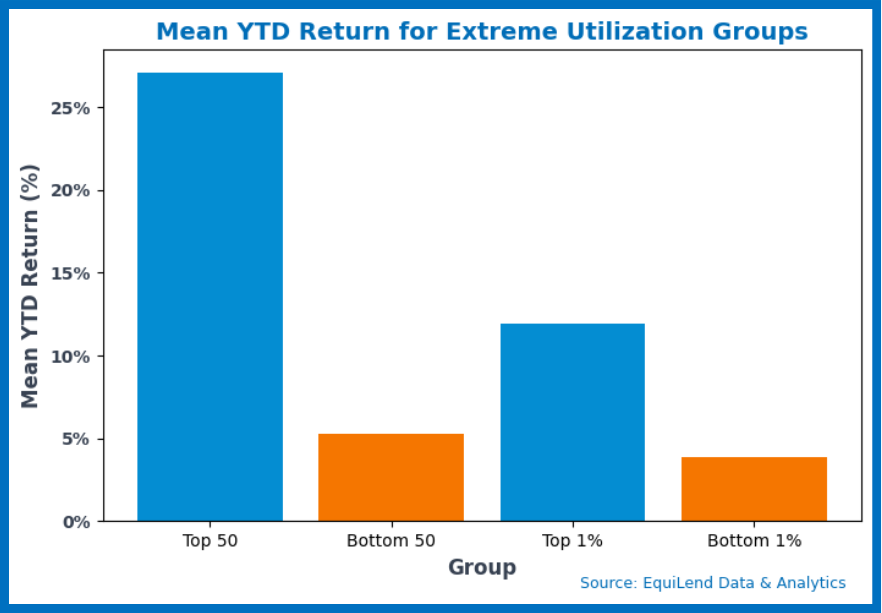
Extreme Group Analysis
- The top 50 most-borrowed stocks (based on average utilization) have experienced an impressive mean YTD return of 27.1%.
- In stark contrast, the 50 least-borrowed stocks have only yielded a mean YTD return of 5.3%.
- Looking at the most extreme cases, the top 1% of most-borrowed stocks (25 stocks) still show a strong mean YTD return of 11.9%.
- The bottom 1% of least-borrowed stocks (25 stocks) have a mean YTD return of 3.9%.
Interpretation
The substantial outperformance of stocks with high average utilization rates, particularly in the top decile and the top 50 most-borrowed group, strongly suggests that short sellers in these names have been under significant pressure. This pressure could be due to a variety of factors, including unexpected positive news, strong market momentum or coordinated buying activity, forcing short sellers to buy back shares to cover their positions and driving prices up further.
The difference in returns between the most- and least-borrowed groups is significant and warrants attention. This pattern suggests a risk-on environment conducive to short squeezes, where high short interest fuels upward price momentum as sellers are forced to cover. Given these conditions, market participants should be wary of maintaining high-conviction short positions and remain aware of stocks susceptible to a squeeze.
Book a demo of EquiLend Data & Analytics today to receive these signals and more in real-time: https://equilend.com/contact-us/.
Bloomberg Terminal users can subscribe to EquiLend’s exclusive short selling and financing data by entering terminal shortcut APPS ORBISA <GO> or clicking the following link: https://on.equilend.com/bloomberg-terminal-page.