Insight
The New Special: The Rise of SPACs and Meme Stocks
Matt Ross
March 2022

Insight
Matt Ross
March 2022
The rise of SPACs and meme stocks has brought new attention to financial markets. Matt Ross, Product Specialist, EquiLend Data & Analytics, surveys the financial landscape with these new instruments.
When DataLend launched in 2013 one would have been hard pressed to find a way to discuss Alex Rodriguez, YOLO memes and securities finance in the same article.
However, the recent boom in SPACs and meme stocks in the financial industry has led to new opportunities in the securities finance marketplace.
SPAC issuance has seen a dramatic rise in recent years, and everyone from athletes, including baseballer-cum-investor Alex Rodriguez, to celebrities to politicians are getting involved. Meme stocks first came about last year when social media investors decided they wanted to invest in their childhood and subsequently sent shares of GameStop (GME) skyrocketing.
DataLend investigates the impact these trends have had in securities finance and digs into the data on these new specials.
According to spactrack.net, there were 55 SPACs issued in 2019, 248 in 2020, 613 in 2021 and 48 so far in 2022 through March 8th. This drastic increase was noticed by investors and subsequently reflected in the securities lending market, and the data shows it. For the purposes of this article, we’ll include both SPACs, the acquisition company, as well as companies that are the result of a SPAC merger when looking at the data. Figure 1 shows the SPAC (as previously defined) on-loan balance in DataLend from the beginning of 2020 through February 2022.
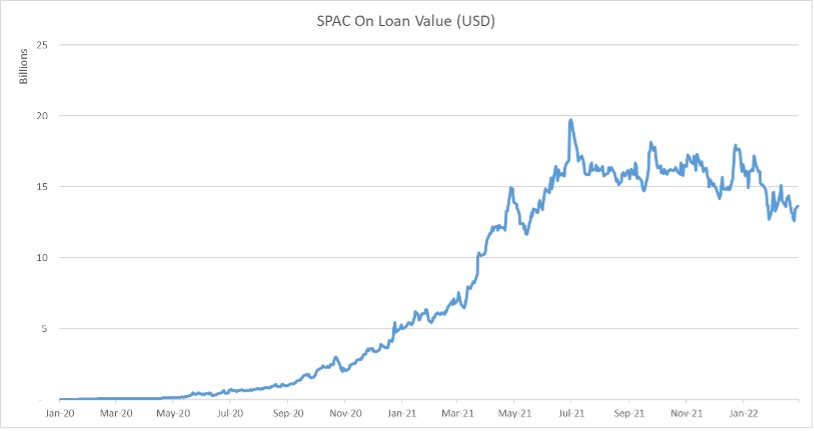
The SPAC on-loan balance has risen from $10 million at the beginning of 2020 to almost $20 billion in July 2021, with an average balance of nearly $15.8 billion from July 2021 through February 2022. While the increasing on-loan value may simply reflect the increasing number of SPACs issued; the utilization and average fees in DataLend confirm that these names are in high demand.
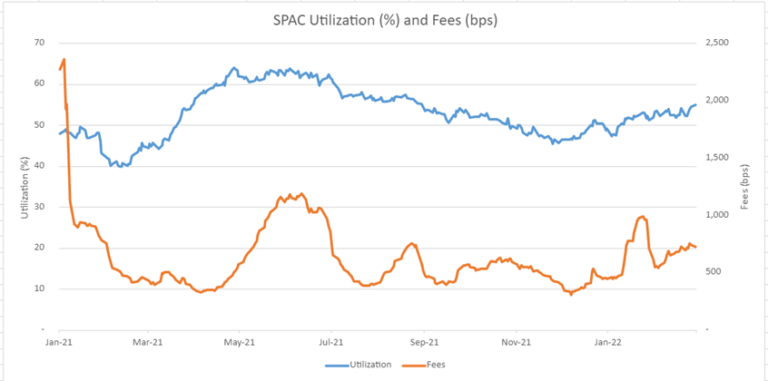
Figure 2 illustrates utilization and average fees for SPACs from January 2021 through February 2022. Utilization began 2021 at sub-50% before dropping to a low of around 40% in February. A subsequent rise mid-year led to a high of 64% and a full year average of greater than 50%, which is very high for an asset class. Fees, while a bit more volatile and sometimes influenced by single names, averaged 603 bps for the year 2021 and never dipped below 330 bps. Early days of 2022 have seen both fees and utilization rising potentially indicating the slight dip towards the end of 2021 was only a temporary reduction in demand for these securities.
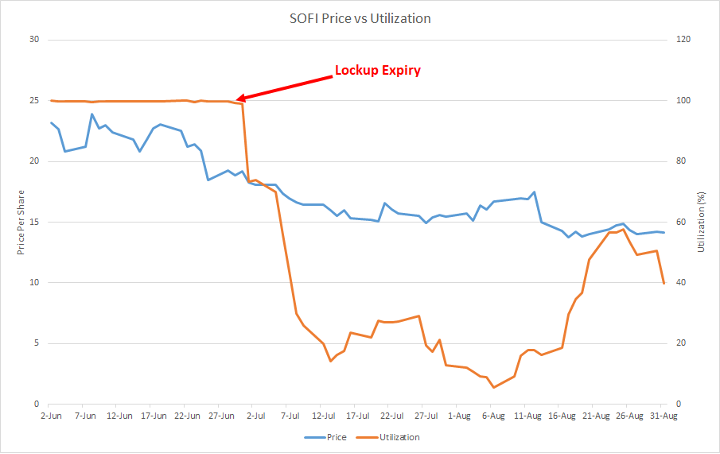
Given SPACs and their unique structures, there are multiple opportunities in the securities lending market, and each one may be different from the next. SPACs typically offer warrants that can be redeemed after certain criteria are met post-merger. This creates a scenario similar to lockup expiry dates for IPOs, where the float available to trade for the security will increase, thus driving the price down and generating demand in the securities lending space prior to that date. However, each SPAC is different. Take, for example, the IPOE-SOFI SPAC merger. The SOFI merger had a unique clause: that if the stock traded above a certain price for 20 out of 30 trading days, then 83% of insider shares would be eligible for sale. That criteria was met on June 28, and prior to that date demand for SOFI was high with utilization nearing 100%. After June 28, as expected, the price dropped, as did the demand in securities lending, as depicted in Figure 3.
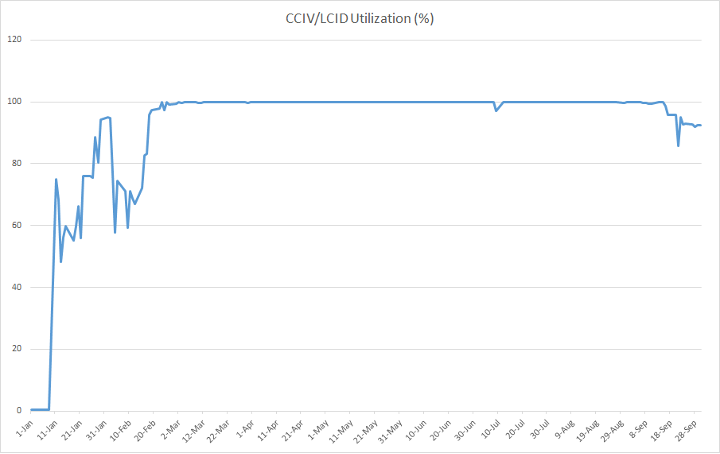
CCIV is another example where different SPAC circumstances may lead to different stock loan demand. In February 2021, CCIV announced that it would merge with Lucid Motors, an electric vehicle company. However, days after the merger was announced Lucid announced delays to their flagship sedan, thus generating demand for CCIV. CCIV did eventually merge with Lucid Motors and now trades under the ticker LCID. Demand is still high, as uncertainty remains around their flagship model and warrant redemption looming.
SPACs and their subsequent mergers also tend to drum up short interest due to their quick route to market. Short sellers argue that SPAC merger targets have the potential to be overvalued due to the fact that less due diligence is performed than with traditional IPOs. Perhaps the most notable scenario was the VTIQ-NKLA merger in 2020, which resulted in NKLA becoming a top-earning security in the lending market for 2020 and a high earner again in 2021.
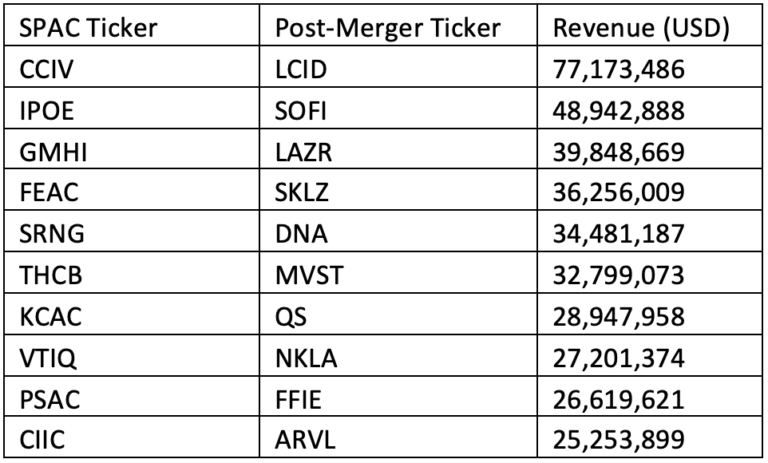
Overall, SPACs and SPAC mergers have been a large source of revenue in securities lending, generating almost $809 million in revenue, or 8.7% of all industry revenue in 2021. Figure 5 shows the top 10 revenue-generating SPACs (pre- and post-merger) for 2021.
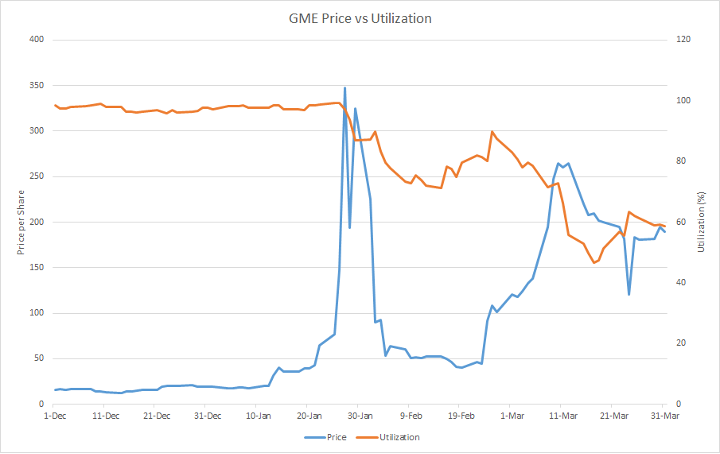
Meme stocks have also been a large source of revenue for securities lending participants. As retail investors buy large sums of shares in names that have garnered the attention of social media enthusiasts, prices go up on these already heavily shorted names, thus generating increased revenue in securities lending. The most well-known example, GameStop (GME), saw prices go from under $20 per share to a high of $483 per share over the course of two weeks in January. With utilization and short interest ratios both around 100%, this saw the on-loan value for GME in DataLend go from $850 million to over $8.4 billion over the same time period. This increase in value caused GME to not only be a top earner in January but also a top 10 earner in 2021.
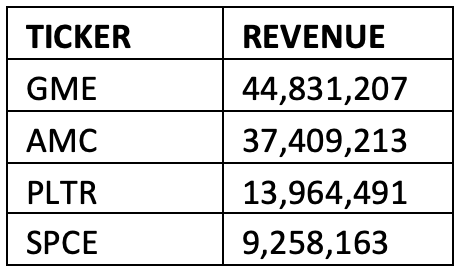
While there’s no exact definition for a meme stock, as it may vary day to day based upon which security gets the most social media mentions, a handful of names have been synonymous with the meme stock mania. Each meme stock example has experienced some level of price increase over the year coupled with high utilization, thus leading to high returns in securities lending. Figure 7 shows the top-earning meme stocks of 2021.
If 2020 and 2021 have taught us anything, it is that we have to be prepared for a new normal. While there are no guarantees in finance, it appears that SPACs and memes may have become a part of the new normal in securities lending. DataLend will continue to monitor these two trends that have largely shaped the market over the last 24 months and be there with all your data needs for tracking SPACs and memes.
The challenge now is to shape the next normal, be that location or regulation, rather than be at pains to adapt to it.
EquiLend is a global financial technology, data and analytics firm offering Trading, Post-Trade, Data & Analytics, RegTech and Securities Finance Platform Solutions for the securities finance industry. EquiLend has offices in New York, New Jersey, Boston, Toronto, London, Dublin, India, Hong Kong and Tokyo and is regulated in jurisdictions around the globe.